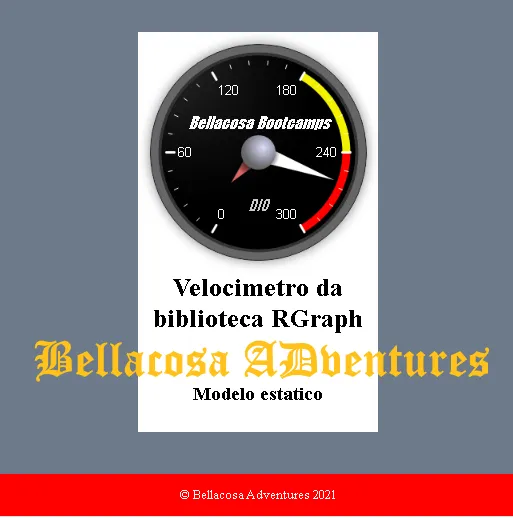
Vamos codar? Crie um velocimetro em Html CSS e Javascript
- #JavaScript
- #HTML
- #CSS
Crie um velocímetro para sua pagina web
Salve padawan, hoje vamos explorar uma nova library em Javascript, ela é preparada para receber parâmetros e criar gráficos dinâmicos, visite a pagina e veja outros modelos: https://www.rgraph.net/
Conheça a biblioteca RGraph uma super biblioteca em javascript para criar gráficos fabulosos e o melhor com pouquíssimo código, melhor que mamão com açúcar, pronto para codar? Arregace as mangas estrale os dedos e mao na massa...
Veja o exemplo funcionando: https://vagnerbellacosa.github.io/ExplorandoLibrary_RGraph/GaugeGraphics/Velocimetro/
Html
<!DOCTYPE html>
<html lang="en">
 <head>

<!-- Apresentaçao -->
<title>JavaScript Velocimetro Chart</title>

<!-- Front-End -->
<link rel="stylesheet" href="style/style.css" type="text/css" media="screen">

<!-- Back-End -->
<script src="../RGraphLibrary/RGraph.common.core.js"></script>
<script src="../RGraphLibrary/RGraph.gauge.js"></script>

 </head>
 <body>

  <div class="container">

  <div class="box">

  <canvas id="cvs" width="300" height="300">
      [No canvas support]
  </canvas>

  <h1> Velocimetro da biblioteca RGraph </h1><br>
  <h2> Modelo estatico </h2>

  <script src="js/script.js"></script>
 </body>
</html>
CSS
.container {
      width: 100vw;
      height: 100vh;
      background: #6C7A89;
      display: flex;
      flex-direction: row;
      justify-content: center;
      align-items: center
  }
  .box {
      width: 300px;
      height: 500px;
      background: #fff;
  }
  body {
      margin: 0px;
  }

  h1 {
text-align: center;
}

  h2 {
text-align: center;
}
E agora vamos a parte mais aguardada, hehehe, o codigo javascript para criar o velocimetro
Script
new RGraph.Gauge({
  id: 'cvs',
  min: 0,
  max: 300,
  value: [260,12],
  options: {
    marginLeft: 15,
    marginRight: 15,
    marginTop: 15,
    marginBottom: 15,

    // Configurando o titulo principal do velocimetro
    titleTop: 'Bellacosa Bootcamps',
    titleTopSize: 13,
    titleTopFont: 'Impact',
    titleTopColor: 'white',
    titleTopSize: 15,
    titleTopItalic: true,

    // Configurando o subtitulo no bottom
    titleBottom: 'DIO',
    titleBottomSize: 14,
    titleBottomItalic: true,
    titleBottomFont: 'Impact',
    titleBottomColor: '#ccc',
    titleBottomPos: 0.4,

    // O resto da configuraçao do velocimento - cores,
    // a seta do mini e macro velocimetro, marcas de velocidade e a borda
    colorsRanges: [[240,300,'rgba(255,0,0,1)'], [180,240,'rgba(255,255,0,0.95']],
    backgroundColor: 'black',
    backgroundGradient: true,
    centerpinColor: '#666',
    needleSize: [null, 50],
    needleColors: ['Gradient(transparent:white:white:white:white:white)', 'Gradient(transparent:#d66:#d66:#d66:#d66)'],
    textColor: 'white',
    tickmarksLargeColor: 'white',
    tickmarksMediumColor: 'white',
    tickmarksSmallColor: 'white',
    borderOuter: '#666',
    borderInner: '#333'
  }
}).draw().responsive([
  {maxWidth:null,css:{'float':'right'},parentCss:{textAlign:'none','float': 'right'}},
  {maxWidth:600,css:{'float':'none'},parentCss:{textAlign:'center','float': 'none'}}
]);
Espero ter ajudado ate o próximo artigo.

 Mais momento jabá, para distrair, visite meu vídeo e veja para onde fui desta vez: https://www.youtube.com/watch?v=CB-mcsP69Rk
Bom curso a todos.
 https://www.linkedin.com/in/vagnerbellacosa/
 https://github.com/VagnerBellacosa/


